
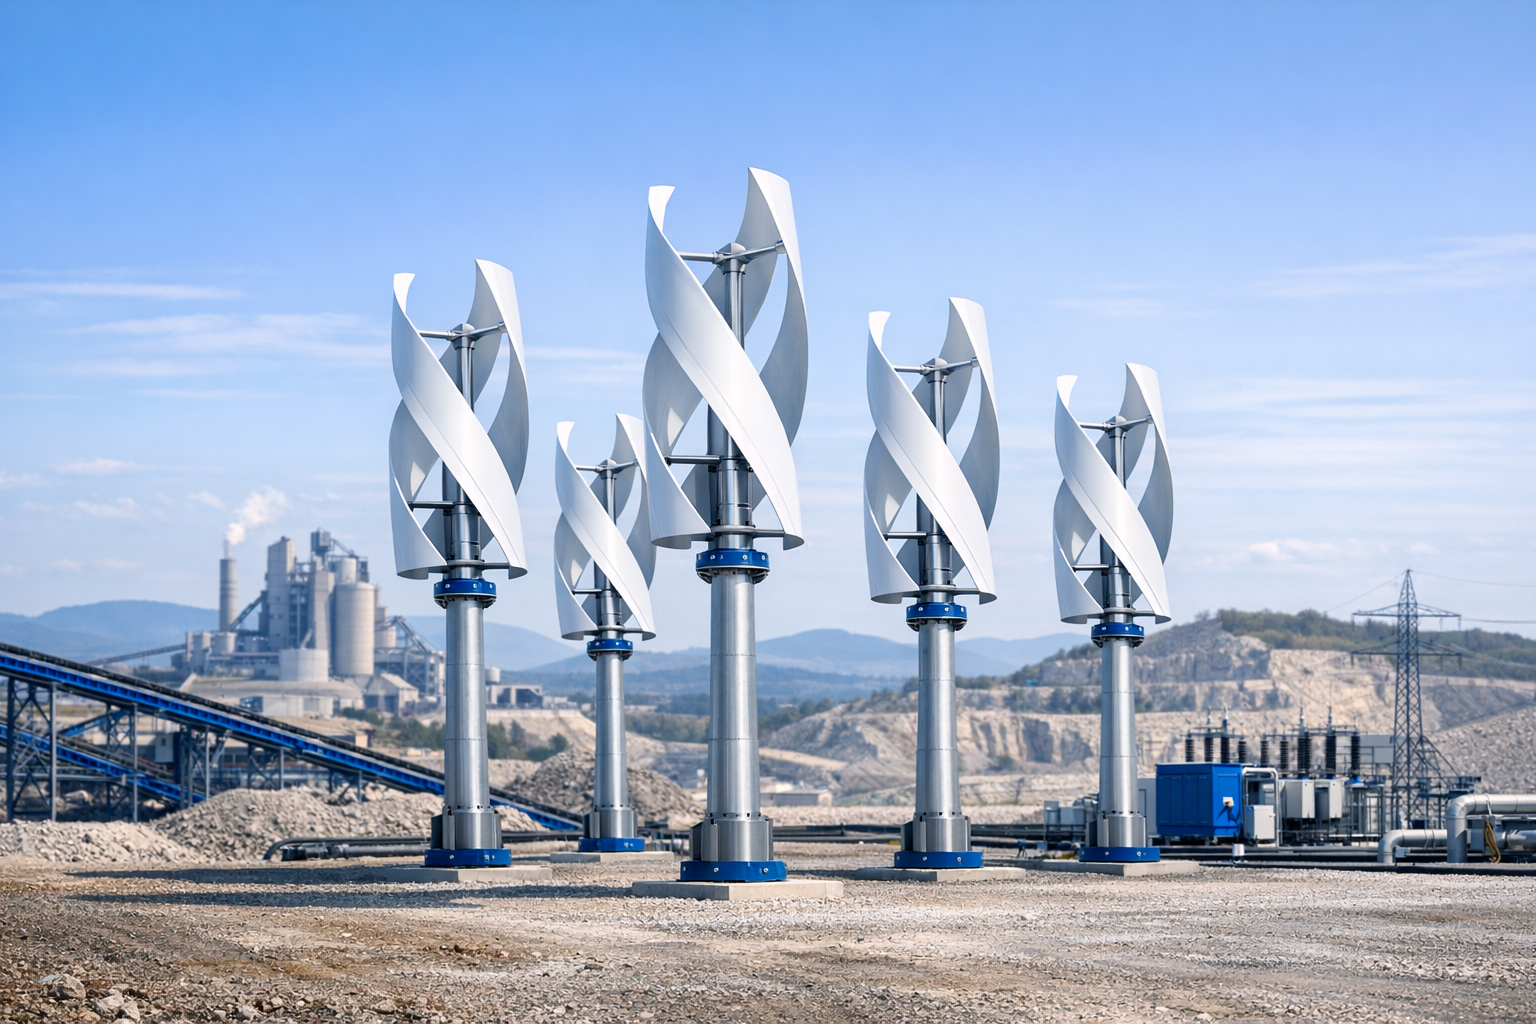
A mid-size cement plant in Bavaria can spend €5-15 million per year on electricity. A quarry operator running crushers, conveyors, and pumps around the clock faces bills that dwarf most fixed operating costs. And every kilowatt-hour of grid power now carries a compounding burden: network charges, levies-and an EU ETS carbon cost that industrial site managers can no longer budget away.
This article is for the person who already understands small wind on industrial sites and now wants the actual numbers: what a cluster of turbines realistically produces, what it costs, how long payback takes, and what the non-financial case looks like for ESG reporting. No filler-just the framework a CFO or energy director needs to pressure-test the idea.
The Energy Cost Baseline for Heavy Industry
Before evaluating any technology, you need an honest baseline. Germany's industrial electricity price landscape in 2025:
- The modeled industrial electricity price for companies without reductions averaged 16.77 ct/kWh in 2024-still structurally high by pre-crisis standards.
- Industrial customers with annual consumption of 24 gigawatt hours paid around 20 ct/kWh in 2024, according to Federal Network Agency data.
- In January 2025, the industrial price for companies with reductions (those already eligible for grid-fee and levy discounts) was 11.69 ct/kWh-but that figure applies to a narrow group meeting strict consumption thresholds.
For cement plants, quarry operators, and aggregate producers at mid-industrial scale without maximum-load discounts, a working assumption of 18-22 ct/kWh is realistic and conservative. That is the price your own on-site generation directly displaces.
Carbon cost pressure is not receding. In 2025, EU ETS allowance prices have fluctuated between €60 and €80 per tonne CO₂. The Carbon Border Adjustment Mechanism (CBAM) enters its definitive regime from 2026, imposing a carbon price on imports including cement-tightening the cost squeeze from two directions for export-exposed producers.
The combined financial logic is straightforward: every kilowatt-hour you generate on-site is one you don't buy from the grid, don't pay levies on, and don't report as Scope 2 emissions.
What Small Wind Can Realistically Deliver
The operative question is not "can a 3 kW turbine power a cement kiln"-it obviously cannot. The question is what a cluster deployment can offset in a targeted way: lighting circuits, conveyor drives, ventilation, water pumping, site offices, and auxiliary equipment that together often represent 10-30% of total plant consumption.
Single-Unit Output
The LuvSide LS Helix 3.0 (3 kW VAWT) at a site with a mean wind speed of 5-6 m/s produces approximately 5,000-8,000 kWh per year. The LS HuraKan 8.0 (8 kW HAWT), optimized for clean airflow on exposed terrain like quarry rims and spoil heap summits, produces approximately 12,000 kWh per year at a good site.
Cluster Output
Deployments scale linearly-and industrial sites typically have the footprint for meaningful cluster configurations:
- 5× LS Helix 3.0 at 5.5 m/s mean wind: ~25,000-32,000 kWh/year
- 3× LS HuraKan 8.0 at 5.5 m/s: ~33,000-38,000 kWh/year
- 5× LS HuraKan 8.0 at 5.5-6.0 m/s: ~55,000-65,000 kWh/year
At a 20 ct/kWh avoided rate, a 3× HuraKan cluster generates roughly €7,000-7,500/year in direct electricity cost savings. That is the floor of the value calculation-before feed-in remuneration on any export, before ETS cost avoidance, and before EU taxonomy-aligned green finance benefits.
Why Industrial Sites Have the Wind Resource
Quarry rims, spoil heap summits, and elevated brownfield plateaus share three favorable properties: elevation above surrounding terrain, absence of residential neighbors who might object to turbine placement, and existing industrial zoning that removes planning complexity. The same topography that makes these areas operationally inconvenient for other purposes is precisely what gives them wind.
A wind speed of 5.0-6.5 m/s at 10-15 m hub height is achievable on many such sites across DACH and Central Europe-verified by mesoscale wind atlases and LIDAR-based assessments. This is not an optimistic assumption; it is the median for elevated industrial terrain in southern Germany and Central Europe.
Investment Cost and Payback Period
Indicative installed costs for small wind systems in Germany range from €3,000 to €8,000 per kW, depending on turbine type, foundation requirements, grid connection complexity, and site accessibility. LuvSide's Made-in-Germany quality positions their systems toward the upper end of the range-a reflection of engineering longevity and reduced O&M, not a premium to be minimized.
For planning purposes:
- LS Helix 3.0 cluster (5 units, 15 kW): Indicative installed cost ~€60,000-90,000
- LS HuraKan 8.0 cluster (3 units, 24 kW): Indicative installed cost ~€95,000-140,000
The table below models four realistic industrial scenarios at current German electricity prices. These are illustrative-every site requires a proper wind resource assessment and detailed engineering cost estimate.
| Scenario | Configuration | Mean Wind Speed | Est. Annual Output | Annual Savings @ 0.20 €/kWh | Indicative CapEx | Simple Payback | CO₂ Avoided / yr |
|---|---|---|---|---|---|---|---|
| A - Quarry rim, Bavaria | 3× LS HuraKan 8.0 (24 kW) | 5.5 m/s | ~36,000 kWh | ~€7,200 | ~€120,000 | ~10-12 yrs | ~18 t CO₂ |
| B - Spoil heap, industrial park | 5× LS Helix 3.0 cluster (15 kW) | 5.0 m/s | ~25,000 kWh | ~€5,000 | ~€75,000 | ~10-11 yrs | ~12.5 t CO₂ |
| C - Quarry rim + PV hybrid (WindSun) | 3× HuraKan 8.0 + 20 kWp PV | 5.5 m/s | ~56,000 kWh | ~€11,200 | ~€175,000 | ~9-11 yrs | ~28 t CO₂ |
| D - Aggregate producer, windy ridge | 8× LS Helix 3.0 (24 kW) | 6.0 m/s | ~48,000 kWh | ~€9,600 | ~€144,000 | ~9-10 yrs | ~24 t CO₂ |
Key sensitivity levers:
| Variable | Effect on Payback |
|---|---|
| Wind speed +0.5 m/s | ~15-20% improvement in annual output |
| Electricity price +2 ct/kWh | ~10% reduction in payback period |
| CapEx grant (BAFA 20%) | ~2 years shorter payback |
| Wind + solar hybrid (WindSun) | Improves capacity factor to 40-50% |
Use the interactive calculator below to model your specific combination:
Why Wind + Solar Is the Right Architecture for 24/7 Industrial Operations
A single renewable technology-whether wind alone or solar alone-cannot reliably match an industrial facility's around-the-clock load profile. The power of a hybrid lies in temporal complementarity:
- Solar generation peaks between April and September, during daylight hours
- Wind generation is typically stronger at night, in winter, and during storm periods-exactly when solar underperforms
For a quarry or aggregate plant running crushers during nighttime hours or in overcast winter conditions, a solar-only deployment leaves significant gaps. A wind-solar hybrid system closes those gaps systematically, improving the effective capacity factor from a typical 15-22% for wind-only to 35-45% for a well-sized combined system.
LuvSide's WindSun platform integrates wind and PV into a single hybrid architecture, sharing inverter infrastructure and battery storage where applicable. WindSun hybrid systems combine LuvSide turbines with PV to approximately 28 kW nominal output, delivering higher total yield and seasonally balanced generation.
For industrial operators, the practical implication is clear: a hybrid deployment can supply a meaningfully larger share of baseload auxiliary demand-not just daytime peaks-which is the fraction of your bill where self-generation delivers the highest value.
Financing and Subsidy Stack
The financing landscape for industrial renewable installations in Germany in 2026 is layered and highly accessible to credit-worthy industrial operators. The most relevant instruments:
KfW 270 - Renewable Energies Standard
The KfW Renewable Energies "Standard" Programme (270) offers low-interest loans for investments in renewable energy for electricity and heat generation, supporting projects in Germany and abroad. The programme targets a wide range of applicants, including natural persons, companies, legal entities, and public law corporations. Eligible investments include the establishment, expansion, and acquisition of renewable energy facilities-including wind power installations.
Crucially, the KfW 270 loan must be applied for before the project begins. The start of the project is considered to be signing the contract with the installer, not the actual construction start.
BAFA Investment Grants
The Federal Office for Economic Affairs and Export Control (BAFA) offers direct investment grants for renewable energy systems, typically covering 15-25% of eligible costs. These can be combined with KfW 270 financing to reduce effective CapEx significantly.
EEG Feed-In Remuneration
Small wind turbines up to 100 kW remain eligible for the 20-year statutory feed-in remuneration under the Renewable Energy Sources Act (EEG). For industrial sites where not all generated electricity can be consumed on-site, a guaranteed revenue stream for exported surplus materially improves project economics.
EU Taxonomy-Aligned Green Finance
Industrial groups pursuing ESG commitments increasingly access green bonds, sustainability-linked loans, and EU taxonomy-aligned credit facilities at preferential rates. Small wind and hybrid installations meeting the "substantial contribution" criteria for climate change mitigation under the EU Taxonomy are directly applicable assets.
Stacking your financing reduces effective payback significantly. A typical industrial small wind project in Germany can combine: KfW 270 low-interest loan (up to €50M) + BAFA investment grant (15-25% of eligible costs) + 20-year EEG feed-in remuneration for surplus generation + accelerated §7g EStG depreciation in year one. Projects that capture all four instruments routinely achieve effective payback periods 2-4 years shorter than CapEx-only calculations suggest. Apply for KfW 270 before signing installer contracts - retroactive applications are not accepted.
The Non-Financial Case: ESG, Scope 2, and EU ETS Compliance
For industrial groups subject to EU ETS reporting obligations and ESG disclosure requirements, on-site renewable generation delivers value that does not appear in a simple payback calculation.
Scope 2 emissions reduction is the most direct benefit. Every kilowatt-hour generated on-site displaces one from the grid. Using the German grid emission factor of approximately 380 g CO₂/kWh[1] (2024 Umweltbundesamt), a cluster producing 36,000 kWh/year avoids approximately 13.7 tonnes of CO₂ per year-directly reportable under the GHG Protocol Scope 2 location-based or market-based method.
EU ETS compliance cost reduction. For cement manufacturers and other large installations covered under EU ETS Phase 4, with ETS1 allowance prices fluctuating between €60 and €80 per tonne in 2025, every tonne of avoided CO₂ from electricity self-generation represents €60-80 in avoided allowance cost or preserved allowance headroom.
CSRD and ESG reporting. Under the Corporate Sustainability Reporting Directive (CSRD), large industrial groups must disclose Scope 1, 2, and 3 emissions with increasing granularity from 2025 onward. On-site renewable assets provide auditable, verifiable emissions reductions that strengthen the energy section of any sustainability report.
Image and procurement advantages. The European Commission's Industrial Decarbonisation Accelerator Act is expected to introduce a voluntary carbon intensity label-initially for steel and later for cement-creating direct procurement advantages for lower-carbon producers. Deploying on-site renewables now is preparation for that competitive landscape.
For a deeper look at how decentralized energy systems fit into the broader geopolitical and regulatory picture, see our analysis of energy scenarios to 2030 and the strategic case for decentralized hybrid systems.
What a Serious Site Assessment Looks Like
Before commissioning a detailed engineering study, an energy manager or facility director can pre-qualify a site with five questions:
- Is there an elevated structure or natural feature (quarry rim, spoil heap, artificial hill, berm) with an unobstructed wind fetch of at least 200-400 m?
- What is the estimated mean wind speed? Check Germany's Wind Energy Atlas[2] or COSMO-REA6 mesoscale data for a first estimate.
- Is the site industrially zoned? Industrial zoning removes the most common planning obstacles for small turbine installations.
- What fraction of site electricity load is auxiliary demand (lighting, ventilation, water pumping, offices) running outside production peaks?
- What is the company's timeline for ESG reporting obligations-and does a renewable asset need to be on the books within the next 12 months?
If answers to questions 1-3 are positive, a LuvSide site assessment and indicative financial model can be produced based on verified wind data, current CapEx estimates, and the applicable financing stack for your jurisdiction.
FAQ
What minimum mean wind speed does a small wind installation need to be viable on an industrial site?
A mean annual wind speed of 4.5-5.0 m/s at hub height is generally the lower threshold for acceptable economics. Most quarry rims, spoil heaps, and elevated brownfield plateaus in DACH and Central Europe reach 5.0-6.5 m/s - well above this threshold. A professional wind resource assessment using site measurements or validated mesoscale data is strongly recommended before committing capital.
Do small wind turbines require a planning or building permit on industrial-zoned land?
In most German federal states (Länder), small wind installations under 10 m hub height on already-industrially-zoned land are exempt from full BImSchG permitting and require only a simplified building permit (Baugenehmigung) or notification under the local zoning code. Brownfield and quarry sites with existing industrial zoning present the lowest regulatory friction. Always verify with your local Bauordnungsamt.
How does a vertical-axis wind turbine (VAWT) differ from a horizontal-axis turbine for industrial use?
VAWTs like the LuvSide LS Helix 3.0 are omnidirectional (no yaw mechanism required), quieter, and tolerate higher turbulence - making them ideal for rooftop installations, areas near buildings, or turbulent environments such as quarry bowl rims. HAWTs like the LS HuraKan 8.0 deliver higher output per unit in clean, open-air flow, making them better suited for exposed ridgelines, spoil heap summits, or elevated brownfield plateaus with unobstructed wind.
Can small wind qualify for EEG feed-in remuneration in Germany?
Yes. Wind turbines with a rated capacity up to 100 kW remain eligible for the EEG statutory feed-in remuneration for 20 years. For installations that qualify, this provides a guaranteed revenue stream for excess generation not consumed on-site, further improving project economics. Registration in the Bundesnetzagentur's Marktstammdatenregister (MaStR) is mandatory within one month of commissioning.
How much CO₂ can a cluster of small wind turbines realistically offset per year?
Using the German grid emission factor of approximately 0.380 kg CO₂/kWh (2024 Umweltbundesamt), a cluster of five LS Helix 3.0 turbines producing around 25,000 kWh/year avoids roughly 9.5 tonnes of CO₂ per year. Three LS HuraKan 8.0 units at the same site producing ~36,000 kWh/year avoid approximately 13.7 tonnes CO₂. These figures are directly reportable under GHG Protocol Scope 2 (market-based or location-based method) and contribute to ESG disclosures.
All output and savings figures in this article are illustrative estimates based on published performance data, industry cost ranges, and current German electricity prices. Actual results depend on site-specific wind resource, installation configuration, and applicable tariffs. LuvSide's ROI analysis for decentralized wind and off-grid industrial sites provides further data on verified deployments.