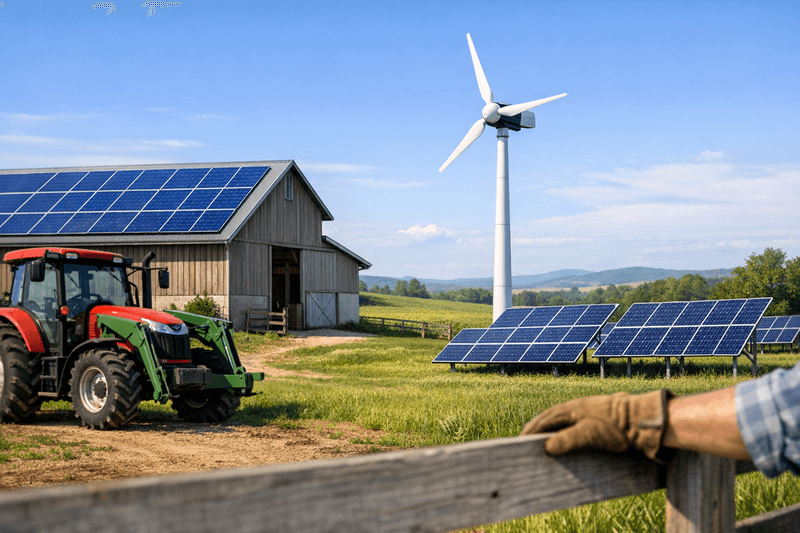
Wind and solar are no longer optional add-ons. For many farms, they are essential for stabilizing energy costs, ensuring operational continuity, and reducing diesel reliance.
In this guide, you'll learn to:
- Assess if a wind-solar hybrid (such as LuvSide's WindSun) is right for your farm
- Estimate annual energy yield from wind and solar for agricultural needs
- Build a straightforward ROI and payback calculation
- Size a hybrid system step by step (at concept level)
- Prepare a practical checklist from assessment to installation
The focus is on solar power for agriculture combined with wind energy for farms. This approach delivers year-round reliability, improved renewable energy ROI, and greater autonomy.
What you need before you start
Make this guide actionable by gathering:
- 12-24 months of energy data
- Electricity bills (kWh and €/kWh)
- Diesel or LPG records for generators or irrigation pumps (liters/year)
- List of energy-intensive farm processes, such as:
- Irrigation and water pumping
- Ventilation and fans in livestock barns
- Milking parlors, compressors
- Cold storage / refrigeration
- Grain drying, processing lines
- Basic site resource information
- Approximate solar irradiation (regional data suffices)
- Approximate wind speeds (annual average, seasonal pattern if available)
- Rough budget range for on-site energy investment (CAPEX window)
- Constraints and priorities
- Space for PV (roofs, Agri-PV, ground mounts)
- Space and height limits for small wind turbines
- Need for existing diesel gensets as backup
Keep this information ready; it will be used in the ROI framework.
Step 1 - Define your autonomy and ROI targets
Before selecting technology, clarify success criteria.
1.1 Identify loads to be powered
List loads for your hybrid system:
- Critical loads (must run)
- Drinking water pumping, livestock ventilation, milking robots, cold rooms
- Flexible loads (can be scheduled)
- Irrigation, some processing, charging electric equipment
- Non-critical loads
- Yard lighting, non-essential buildings
Estimate annual consumption and seasonality:
- kWh/year per major load (from bills, meters, equipment specs)
- Summer vs. winter demand (e.g. irrigation peaks in summer, barn ventilation in winter)
Tip Without sub-metering, start with total farm kWh/year and estimate the percentage for each activity. Refine this as more data becomes available.
1.2 Set autonomy and payback expectations
For most farms, reliable targets are:
- Autonomy: e.g. 50-80% of annual electricity demand from renewables
- Simple payback: e.g. 5-12 years, matching your investment horizon
Research indicates many agricultural PV systems repay investment within 4-10 years, depending on subsidies, tariffs, and replaced diesel.In several recent case studies, agricultural PV or solar-powered irrigation systems achieved simple payback times between roughly 3.8 and 7 years, faster than comparable diesel-based or grid-only solutions in the same settings1International Journal of Environmental Sciences
Set realistic and regionally appropriate targets that significantly improve your cost structure.
Step 2 - What wind-solar hybrids can deliver for farms
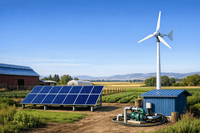
A wind-solar hybrid combines:
- Photovoltaics (PV): peak at midday and summer
- Small wind turbines: often stronger in winter, at night, and during storms
This addresses a core agricultural challenge: seasonal and daily variability in both loads and solar resource.
2.1 Why combine wind and solar?
Seasonal balance: In many regions, winter solar yield drops while wind remains strong. Wind supports winter barn loads or base demand, reducing storage needs.
Diurnal balance: Wind generates during evenings, nights, or cloudy periods, reducing battery and diesel backup requirements.
Load matching: Irrigation and pumping can be timed for windy or sunny hours; cold storage and ventilation benefit from a continuous supply.
Hybrid systems demonstrate increased reliability and lower manual operation compared to single-technology setups.Field demonstrations of hybrid wind-solar water supply systems for pasture and irrigation have shown that combining both resources can reduce operating labor and improve reliability compared to stand-alone PV or wind systems2Full article: Demonstration of a remote-controlled hybrid wind–solar water pumping system
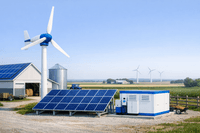
2.2 The LuvSide WindSun advantage
LuvSide specializes in small wind turbines and hybrid solutions built for autonomy and durability. Highlights for farm operators:
- Purpose-designed small wind turbines (vertical and horizontal axis) for decentralized energy
- WindSun hybrid system: integrates a LuvSide turbine with PV as an optimized packageLuvSide's WindSun hybrid solution combines a small wind turbine with photovoa nominal output of around 28 kW at a wind speed of 11 m/s
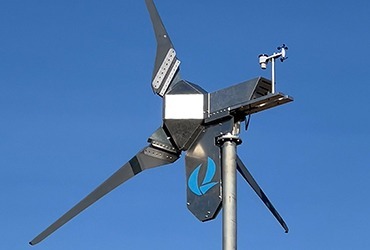
- Optimized rotor and lamella geometry for efficiency and stabilityLuvSide's turbines use flow-optimized rotor and lamella geometries that deliver more than 25% higher efnal Savonius-type small wind designs
- Quiet, compact, robust systems suitable for rural and sensitive locations
For higher energy demands, horizontal turbines like the LS HuraKan can be added:The LS HuraKan 8.0 small wind turbine is rated at about 8 kW at 11 m/s and can produce roughly 12,000 kWh per year at a suitable wind site-ideal for continuous farm baseloads such as barns, pumps, or refrigeration.
Tip Where strong winter winds and high winter loads exist, wind within a WindSun setup can significantly raise autonomy during low-solar seasons.
Step 3 - Establish your baseline: current energy cost and risk
A solid ROI calculation starts with a clear baseline.
3.1 Calculate your annual energy costs
Grid electricity:
- From invoices, total kWh/year and average price (€/kWh).
- Calculate: Grid_cost/year = Grid_kWh/year × Grid_price (€/kWh)
Diesel/LPG generators:
- Collect liters used per year and fuel price.
- Estimate generator efficiency (kWh per liter; use 3-4 kWh/liter if uncertain).
- Calculate:
- Diesel_cost/year = Liters/year × Fuel_price (€/liter)
- Diesel_kWh/year = Liters/year × kWh_per_liter
Total baseline: Total_energy_cost/year = Grid_cost/year + Diesel_cost/year
3.2 Identify cost and supply risks
Key risks a hybrid system can address:
- Exposure to volatile fuel prices
- Grid outages or weaknesses impacting irrigation, milking, cooling
- Generator maintenance and logistics (fuel deliveries, servicing)
- Regulatory pressure to reduce CO₂ emissions or meet standards
Common mistake ROI is often underestimated by ignoring downtime costs or extra labor from fuel logistics. Hybrids can address these hidden costs.
Step 4 - Estimate site-specific solar and wind energy yields
At this stage, first-order estimates are sufficient.
4.1 PV yield (kWh per kWp)
For Central Europe, typical PV yields are well established.For well-sited PV systems in central Europe, typical annual yields are on the order of 800-1,100 kWh per installed kWp, depending on orientation, shading and location3Photovoltaics Report Commonly, 1,000 kWh/kWp/year is used for planning.
PV annual yield:
PV_kWh/year ≈ PV_capacity_kWp × Site_yield (kWh/kWp/year)
Example: A 50 kWp system with 1,000 kWh/kWp/year ≈ 50,000 kWh/year
4.2 Small wind yield (kWh per kW)
Wind output depends on average wind speed, hub height, and turbine design.
- General guideline:A modern 1 kW small wind turbine at a decent wind site can generate roughly 1,500-3,000 kWh of electricity per year4Solar power plants for farmers: payback, calculations and benefits in 2025
- Manufacturer data for specific turbines yield refined estimates (e.g., LS HuraKan 8.0: 12,000 kWh/year at 11 m/s).
Wind annual yield:
Wind_kWh/year ≈ Wind_capacity_kW × Specific_yield (kWh/kW/year)
Use regional wind maps, met masts, or existing turbines as a validation check. For larger projects, professional assessment is worthwhile.
4.3 Combine yields for hybrid profile
At concept stage, sum annual kWh:
Hybrid_kWh/year = PV_kWh/year + Wind_kWh/year
Detailed hourly modeling refines storage and self-consumption later.
Step 5 - Translate energy yields into cost savings
Now connect kWh with euros.
5.1 Estimate self-consumption
Hybrid energy divides into:
- Self-consumed - directly offsets grid/diesel use
- Exported/curtailed - fed to grid at lower tariffs or unused
Designing for farm loads allows high self-consumption. Start with a conservative rate (e.g., 60-80%). Adjust with your own data or integrator insights.
Self_consumed_kWh/year = Hybrid_kWh/year × SCR
5.2 Calculate energy value
Split savings by energy type replaced.
Grid replacement:
Grid_savings/year = Self_consumed_kWh_from_grid × Grid_price (€/kWh)
Diesel replacement:
Diesel_cost_per_kWh = Fuel_price (€/liter) ÷ kWh_per_liter Diesel_savings/year = Self_consumed_kWh_from_diesel × Diesel_cost_per_kWh
5.3 Add quantified additional benefits
- Income from feed-in tariffs or power purchase agreements
- Reduced generator maintenance from fewer hours run
- Avoided CO₂ costs or taxes
Analyses show well-sized farm PV cuts bills for high-load areas by around 60-80% with substantial self-consumption. Wind hybrids extend this benefit to low-solar seasons.
Common mistake Omitting diesel runtime reduction undervalues ROI. Hybrids save fuel, maintenance, and logistics with every generator hour avoided.
Step 6 - Estimate WindSun-type hybrid system CAPEX and OPEX
6.1 Capital expenditure (CAPEX)
Primary CAPEX items:
- PV modules and mounting
- Small wind turbines (e.g., LS Double Helix, LS Helix, LS HuraKan)
- Inverters, hybrid controllers
- Batteries (for higher autonomy targets)
- Foundations, masts, cabling
- Engineering, permits, installation
Request preliminary quotes using:
- PV capacity (kWp)
- Wind capacity (kW/number of turbines)
- Storage need (kWh)
- Site specifics
6.2 Operating expenditure (OPEX)
Plan for:
- Regular inspection and maintenance
- Insurance
- Monitoring and diagnostics
- Occasional repairs
With no fuel costs, OPEX is mainly planned maintenance. LuvSide offers full service from planning to upkeep for simplified budgeting.
Tip Unlike diesel, hybrid OPEX remains stable over the 15-20+ year life-diesel OPEX increases with fuel prices and runtime.
Step 7 - Build a simple ROI and payback model
With yield, savings, and costs estimated, assemble a transparent ROI model.
7.1 ROI calculator framework
Use this worksheet for calculations ("Your value" to be filled):
Inputs
| Item | Description | Your value |
|---|---|---|
| A1 | Annual grid consumption (kWh/year) | |
| A2 | Annual diesel energy (kWh/year) | |
| A3 | Grid price (€/kWh) | |
| A4 | Diesel cost per kWh (€/kWh) | |
| B1 | Planned PV capacity (kWp) | |
| B2 | PV yield (kWh/kWp/year) | |
| B3 | Planned wind capacity (kW) | |
| B4 | Wind yield (kWh/kW/year) | |
| C1 | Self-consumption rate (%) | |
| D1 | Total CAPEX (PV + wind + storage + BOS) (€) | |
| D2 | Annual OPEX (maintenance, insurance, etc.) (€) |
Core calculations
| Formula | Result |
|---|---|
| E1 Hybrid_kWh/year = B1×B2 + B3×B4 | |
| E2 Self_consumed_kWh/year = E1 × C1 | |
| E3 Annual_savings = (Share replacing grid × A3 + Share replacing diesel × A4) × E2 | |
| E4 Net_annual_benefit = E3 - D2 | |
| E5 Simple_payback (years) = D1 ÷ E4 | |
| E6 Year-1 ROI (%) = (E4 ÷ D1) × 100 |
Tip Run conservative, expected, and optimistic scenarios by varying yields, self-consumption, and energy prices to test project robustness.
7.2 Energy vs. financial payback
Two payback types:
- Energy payback: Time to produce the system's embodied energy.
- Financial payback: Time to recover investment through savings.
Recent analyses by Fraunhofer ISE show that modern PV systems manufactured in Europe and installed in Northern Europe can repay the energy used in their manufacture in roughly 1-1.5 years. Financial payback is usually longer and depends on tariffs and load profile.
Step 8 - Sizing a WindSun hybrid: real-world example
A sample scenario for illustration (numbers are indicative):
8.1 Farm profile
- Dairy farm with irrigation and cold storage
- Total electricity: 150,000 kWh/year
- 30,000 kWh/year from diesel during outages
- Autonomy target: 70% of demand from renewables
- Good wind and solar resource
8.2 Sizing
- PV: 80 kWp at 1,000 kWh/kWp/year = 80,000 kWh/year
- Wind: Two LS HuraKan 8.0 turbines (~16 kW) at ~12,000 kWh/year each = 24,000 kWh/year
- Combined yield: 80,000 + 24,000 = 104,000 kWh/year (about 69% of demand)
- Self-consumption: 75% assumed = 78,000 kWh/year offsetting grid/diesel
- Savings and payback (example):
- Avoided cost: 0.30 €/kWh
- Annual savings: 78,000 × 0.30 € = 23,400 €/year
- CAPEX: 230,000 €; OPEX: 3,000 €/year
- Net benefit: 23,400 - 3,000 = 20,400 €
- Simple payback: 230,000 / 20,400 ≈ 11.3 years
Refine with more accurate quotes, simulations, and storage sizing.
Common mistake Oversizing storage instead of capitalizing on wind's complementarity with solar. Smart WindSun sizing can reduce battery needs and still improve autonomy.
Step 9 - Link ROI to productivity and resilience
A WindSun system's value extends beyond energy savings.
Consider:
- Livestock and crop protection during outages
- Stable water supply for irrigation
- Support for precision agriculture (automation, sensors, electric tools)
- Improved sustainability profile and certifications for financing or customers
Studies on solar-powered irrigation and farm electrification report not only shorter payback times compared to diesel-based systems, but also significant reductions in CO₂ emissions per farm per year1International Journal of Environmental Sciences. Wind-solar hybrids amplify these gains by increasing renewable coverage.
LuvSide's focus on decentralized, autonomous energy ensures small wind and hybrid systems deliver long service life, quiet operation, and resilience, from coastal regions to remote farms.
Step 10 - Implementation checklist: assessment to installation
A stepwise checklist for a successful project rollout.
Phase 1: Feasibility & ROI
- Collect 12-24 months of bills and diesel logs
- Identify critical and flexible loads (kW, kWh/year, seasonality)
- Gather basic wind and solar data for your site
- Draft hybrid concepts (PV size, turbine number/type, storage)
- Use ROI framework for conservative/expected/optimistic analysis
- Set autonomy and payback goals
Phase 2: Technical pre-design
- Engage a specialist (e.g., LuvSide) for:
- Preliminary yield simulation (hourly, seasonal)
- Structural review for turbine masts and PV mounts
- Grid connection concept and protection
- Validate noise, shadow flicker, and safety zones
- Optimize hybrid sizing (PV, wind, storage) via simulations
Phase 3: Permitting & financing
- Clarify permits for wind turbines and PV
- Check eligibility for subsidies or loans
- Align with bank/investors on CAPEX and payback
Phase 4: Procurement & installation
- Finalize technical specifications
- Sign contracts with clear warranties
- Schedule installation for minimal farm disruption
- Commission system with tests and training
Phase 5: Operation & optimization
- Set up monitoring (dashboard, alerts)
- Plan regular inspections and maintenance
- Review and adjust performance after 6-12 months
- Update ROI annually with real data
Frequently Asked Questions (FAQ)
1. What payback period is realistic for a WindSun hybrid on a farm?
It varies by tariffs, subsidies, and diesel displacement. Typically, solar-only systems for self-consumption on farms see payback in 4-10 years; WindSun hybrids displacing more diesel may shorten this.Analyses of PV for farms and solar-powered irrigation in Europe and Asia report payback times from around 3-4 years (with strong support schemes) up to about 10 years under less favorable conditions Matching windier seasons and high diesel use improves payback.
2. How big does my farm need to be for a small wind turbine?
Energy demand and wind resource matter more than farm size. Smaller farms with high energy needs at strong wind sites may benefit more than larger, low-consumption operations. WindSun hybrids fit where you have:
- Continuous/year-round loads (barns, pumps, cold rooms)
- High tariffs, frequent outages, or high diesel reliance
- Verifiable wind resource
LuvSide's range flexibly scales for different farm requirements.
3. Are batteries always needed in a WindSun system?
No. Options depend on your resilience requirements and budget:
- No/minimal storage: Offsets daytime/windy-period loads; grid/diesel as backup
- Moderate storage: Covers short outages or optimizes self-consumption
- Larger storage: Targets high autonomy, valuable in unreliable/expensive grid or diesel scenarios
Choose based on outage risks, energy tariffs, and process sensitivity. Often, a moderate battery plus WindSun balances resilience and returns.
4. How accurate are these yield and ROI estimates?
These methods aid early-stage decisions. Actual results vary with:
- Site conditions: wind, solar availability
- System design: model selection, layout
- Operation: load shifting, maintenance
For investment, partner with experts offering:
- Professional resource assessments
- Bankable yield reports
- Clear service packages and guarantees
5. How do WindSun hybrids support CO₂ reduction and compliance?
WindSun hybrids reduce grid and diesel use, lowering CO₂ emissions.Comparative studies of solar-powered versus diesel-based irrigation on farms show substantial reductions in annual CO₂ emissions per farm when diesel is displaced by renewables1International Journal of Environmental Sciences This supports:
- ESG and sustainability reporting
- Regulatory compliance
- Access to green financing and buyer preference
LuvSide's goal is enabling sustainable, decentralized, autonomous energy with robust, Made in Germany wind and hybrid systems-helping farms meet profitability, climate, and resilience needs.